Gain insight into our approach
A systematic and data-driven virtual-FTE strategy could lead to bigger opportunities to reduce overall space and cost.
When some full-time equivalents (FTEs, or full-time employees) work outside the office, overall space per FTE, and presumably cost per FTE, will be lower. In case this isn’t intuitively obvious, the average rentable “Size per FTE” of companies in BenchCoRE’s database that have deployed virtual-FTE strategies is 254 square feet, versus 324 square feet for companies in the database without such strategies – a 22 percent advantage. See EXHIBIT 1.

What’s less obvious (and a dilemma for many corporate real estate leaders) is the optimal number of virtual FTEs as a percentage of total FTEs. What percentage would drive a meaningful reduction in space per FTE without compromising other workplace objectives? BenchCoRE data can help guide the decision process.
BenchCoRE analyzed 19 subscriber companies that have deployed virtual-FTE strategies. The analysis considers two BenchCoRE metrics side by side: “Virtual FTEs as a Percentage of Total FTEs” and “Size per FTE” (including virtual FTEs). The
analysis reveals the following:
The average number of “Virtual FTEs as a Percentage of Total FTEs” is 21 percent.The average “Size per FTE” (including virtual FTEs) is 254 square feet. Of companies with above-average “Virtual FTEs as a Percentage of Total FTEs,” seven of eight have below-average overall “Size per FTE.” See EXHIBIT 2.
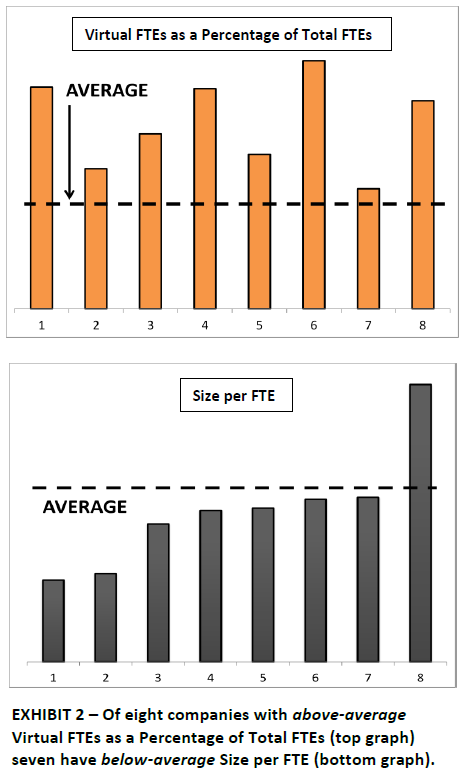
(The graphs above and below are based on actual BenchCoRE data and are designed to illustrate relative values. Actual values are deleted to maintain subscribers’ confidentiality. Each bar represents one company, and the bars in the top and bottom graphs correspond to one another.)
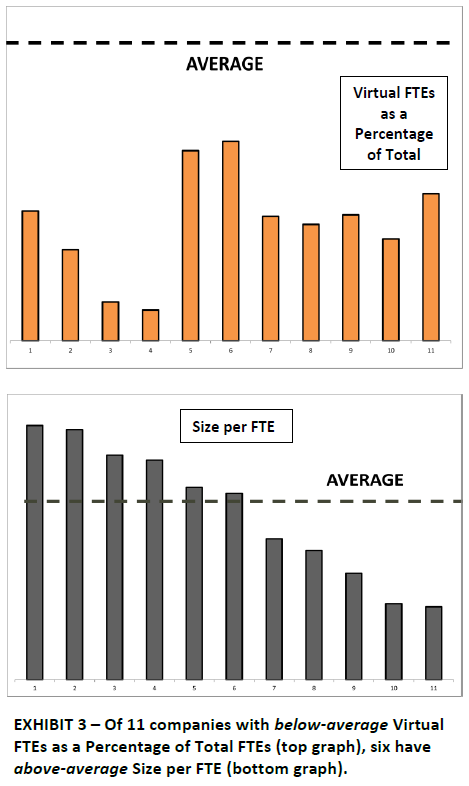
Of companies with below-average “Virtual FTEs as a Percentage of Total FTEs,” six of 11 –a majority, albeit a less dramatic one – have above-average overall “Size per FTE.” See EXHIBIT 3.
The case study’s population represents major global corporations with large headcounts and correspondingly large real estate footprints. The results of the analysis provide guidance to companies considering either implementing virtual-FTE strategies or expanding current strategies. Individual companies’ relationships to the averages give CRE leaders a benchmark to target for virtual FTEs and to
compare their data against those of their peers and best-in-class companies. Of course, the reduction in Size per FTE would depend in part on the size of the space that the virtual FTEs are vacating.
The numbers presented here don’t necessarily establish a proportional relationship between the rise in one metric and the drop in another. They don’t point to a virtual-FTE target beyond which returns might diminish. However, the point of the benchmark – and of most benchmarking, for that matter – is threefold: to provide directional guidance, to move beyond reliance on limited personal experience, and to remove guesswork from the decision-making process.
The virtual-FTE metric contributes to broader analyses when it’s considered in the context of other BenchCoRE metrics, such as “Asset Class Mix.” The ability to deploy virtual-FTE strategies, and hence reap the benefit of reduced real estate costs, understandably varies, depending on the industry cohort and that cohort’s portfolio mix. But similarities among cohorts’ portfolio mixes point to opportunities.
For example, office space makes up about 85 percent of Financial Services (FS) companies’ portfolios (in the total BenchCoRE population); call centers make up roughly 4 percent. These asset classes probably lend themselves to virtual-FTE strategies more easily than, say, facilities in the Manufacturing/Retail cohort (which presumably require more space per FTE). Of the five FS companies among BenchCoRE subscribers that deploy virtual FTEs, three have above-average “Virtual FTEs as a Percentage of Total FTEs”; all three have below-average overall “Size per FTE.”
Tech companies, with about 80 percent office space, and Insurance companies, with about 70 percent office space and 15 percent call center space, have asset mixes similar to those of FS companies. They would appear to have opportunities to implement ambitious virtual-FTE strategies. Nine companies in those two BenchCoRE cohorts do deploy virtual FTEs, but only four have above-average “Virtual FTEs as a Percentage of Total FTEs” metrics and the corresponding below-average “Size per FTE.” The data suggest that the other five are missing opportunities.
Virtual FTEs are just one element of a broader space-use strategy that includes qualitative as well as quantitative elements. Ultimately, tactics such as seat sharing, collaborative space and benching are designed to provide a more desirable and more productive workplace, not merely to reduce Size per FTE. Other metrics add color and depth to the analysis of virtual FTEs and their benefits. For example, the relationship between “Size per Seat” and “FTEs per Seat” (the subject of another BenchCoRE case study) also contributes to an effective space-use strategy. But understanding the interdependency among metrics is a major step toward using the data to identify potential benefits.
As with all BenchCoRE metrics “Virtual FTEs as a Percentage of Total FTEs” and “Size per FTE” do more than describe how subscribers measure up to their peers and best-in-class companies. They serve as decision tools that point the way to effective strategies, especially when one considers the impact that one metric has on another.
Accurate and meaningful data allowing for cross-company comparisons has been problematic and very difficult to find in the CRE industry. With BenchCoRE, corporate real estate executives now have a practical tool to escape the narrow limits of introverted experience and intra-company analytics. This case study reveals the power of data and benchmarking.
By investing in a rigorous data validation process, BenchCoRE provides members with a consistent, trusted and reliable set of industry peer data that can be analyzed at increasing levels of specificity to pinpoint significant opportunities. The BenchCoRE member featured in this case study was able to identify the causes behind their overall cost position and utilize the data in a focused way to prioritize the largest and most achievable opportunities.
Comparing cost to space utilization drivers
Informed with BenchCoRE’s opportunity analysis, the real estate team ran a report comparing their cost per FTE for office space in a target geography, and discovered that they were operating at the high end of the range, both within and outside their own industry peer group. An example of a Cost per FTE report follows, showing an average of $9,350 and a wide range of outcomes from under $6,000 per FTE to over $12,000 per FTE:

In the graph, the yellow bars represent the company’s own industry peer group, whilethe green bars represent a different peer group of office users that they examined to augmentthe comparison set. Note that consistent with our protocols, we have masked the actual values, but the bar chart itself is otherwise unaltered. The chart represents cost per FTE for office properties and the system allowed the member to select for geography, exclude the impact of virtual FTE’s, and eliminate surplus properties.
By reviewing the individual data points, the member was able to identify not only their cost versus the average – which is how most benchmarking comparisons are done – but also the range of individual values. This detail and visibility into the real numbers provide valuable additional insight. By way of example, a real estate executive using the above chart would quickly observe a large clustering in the $6,000 to $7,000 range, indicating that this performance level is realistically achievable.
Using BenchCoRE analytics, the member further “drilled down” to additional performance driver metrics, including:
- Square Feet per Seat
- Number of FTE’s per Seat
- Cost per Square Foot
The member was able to see an immediate graphic display that revealed that their space efficiency metrics (i.e., square feet or square meter per seat and FTE per seat) were generally in line with their peer set. For instance, the square feet per seat metric ranged from about 180 to about 320, with the member coming in close to 240.
Cost per Square Foot Comparisons, Down to the City Level, Were Examined
The BenchCoRE participant learned that its cost per square foot for office space was higher than its industry peers, which in turn drove an opportunity to reduce its high occupancy costs vis-à-vis the peer group and other office users. However, because its cost profile of owned vs. leased properties differed, the real estate team needed to differentiate the company’s cost profile by ownership type. Leveraging BenchCoRE’s report filtering capabilities, the participant prepared a targeted report that revealed detailed cost metrics for owned vs. leased office properties within the study area geography.
For owned properties, the company learned that its property depreciation was higher than that peer group companies – a fact reflecting a series of recent, high-cost investments in new facilities. The team also learned that their operating expenses – which are more controllable – were actually fully in line, if not somewhat better than, the peer group average, possibly as a result of these capital investments. The senior CRE executive recognized that their investment decisions led to a higher G&A cost profile, and that there were more productive initiatives than pursuing aggressive cost management initiatives in the owned-property portfolio.
For leased properties, the company learned that they had one of the highest cost footprints among their peers. Because BenchCoRE allows executives to target costs by geography and down to the city level, the end-user team ran comparative reports at the city level, targeting their largest locations. As a result, using the market data from other CoreNet members, they were quickly able to identify the specific leases that were driving their overall cost position.
From this analysis, the team was able to prioritize the major cost saving opportunities and, furthermore, tie back each of these individual initiatives to an overall projected portfolio average. The team intends to use the BenchCoRE system to continue to benchmark their portfolio, thus creating a longitudinal view of their performance over time, both relative to their baseline and to their peers.
Benchmarking takes us beyond tactical CRE analysis and toward broader corporate performance management.
Corporate real estate managers start to become strategic leaders when they recognize their portfolios’ impact not only on real estate costs and financial performance but also on broader enterprise strategy. That’s one way to get closer to the proverbial seat at the table.
When CRE managers master the multi-layered data associated with their real estate portfolios, they can look beyond the transactional nature of real estate and make broader, data-informed strategic decisions. A metric as elemental as real estate cost per full-time employee equivalent, or FTE, exemplifies this. By understanding the interdependency of the cost components, you can see that a real estate portfolio is more than just a collection of facilities and costs; it’s a key element of broader corporate strategy.
The first steps toward this more strategic analysis are to harness your cost data and isolate its components. You can then benchmark the components against those of peer companies – companies in your industry or whose portfolios have characteristics (property types, geographical locations, etc.) similar to yours. Once you see how each metric stacks up, the opportunities become clear. What’s more, you’ll see how your tactical real estate decisions can support or hinder corporate performance, and you’ll establish strategic priorities that are consistent with – or even help drive – broader corporate strategy.
Start the analysis with Cost per FTE, in this case for a single industry segment, or cohort, in the BenchCoRE database. (The graphs in this paper are actual BenchCoRE reports; values are deleted to maintain subscribers’ confidentiality. Companies are shown in the same left-to-right order in each graph.)
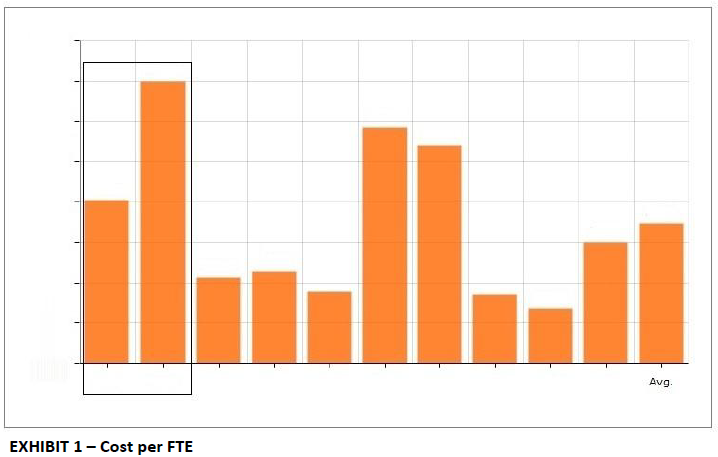
The bars in EXHIBIT 1 represent CRE Cost per FTE for the cohort companies. It’s easy to see that the highest-cost company has an opportunity, even compared with a peer whose costs are higher than average. The CRE team could consolidate locations as leases expire or consolidate employee teams so they occupy less space, assuming this is feasible geographically. There might be other tactics as well. But when you break down those costs into their components, more strategic decision alternatives emerge. Consider the two components of cost per FTE: Cost per Size (i.e., square foot or square meter) and Space per FTE.

A comparison between the two highest-cost companies in the cohort reveals in EXHIBIT 2 that each is paying virtually the same rate. Yet we saw in EXHIBIT 1 that the cost for one is about two-thirds that of the other. What’s going on?
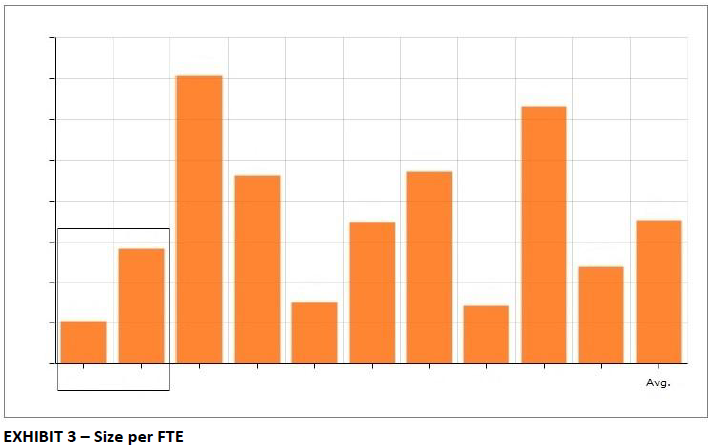
The answer lies in the Size per FTE metric (EXHIBIT 3), which, in the case of the two peers, accounts for virtually the entire difference in cost per FTE. Expanding the analysis to the other peers in the exhibits, you can see that the effects of these two components, Cost per Size and Size per FTE, differ widely in their impact on Cost per FTE.
The Cost per FTE report enables users to benchmark overall costs against those of peers. However, by separating costs into its two components – Size per FTE and Cost per Size – users can benchmark each factor’s contribution against that of each peer in the BenchCoRE cohort. In particular, putting the two metrics together in one graphic – the Cost Driver Tree (EXHIBIT 4) – helps explain stronger and weaker performers in the Cost per FTE report by isolating each peer’s key cost components.
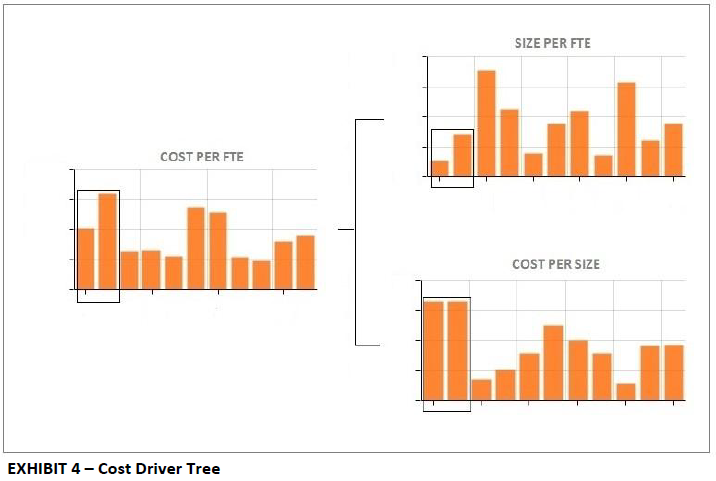
This takes the analysis further and starts to transform a tactical exercise into bona fide strategy. The next step is to break down Size per FTE into its two components, Size per Seat and FTE per Seat. When you put the Cost Driver Tree elements side-by-side visually with BenchCoRE reports for these two metrics (FIGURE 5), you unearth opportunities for designing a potentially transformational real estate portfolio. You’ve expanded the discussion beyond cost metrics to encompass strategic – even “cultural”– factors such as mobile workforces, virtual work teams and collaborative workspace design.

In taking the analysis to these additional levels, you can help design CRE strategy that’s consistent with – and could even help drive – your company’s HR, IT, workspace-design, and construction strategies. You could even add value to corporate marketing discussions, as workspace design could help promote a culture of innovation and magnify a company’s reputation for creative leadership.
The process – isolating costs, visualizing cost factors side-by-side, and benchmarking against peers – has removed the CRE “echo chamber” of anecdotes and personal bias and replaced it with data-informed decision making. Benchmarking has taken us beyond tactical metrics and toward broader corporate performance management. Cost analysis has morphed into transformational strategy.
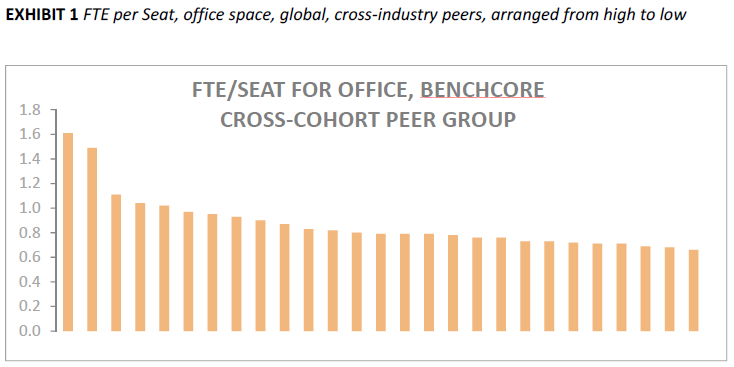
We know from BenchCoRE’s subscribers that one of the most meaningful metrics for the effective management of a corporate real estate portfolio is the FTE per seat ratio. Savvy corporate real estate executives understand that a measure of space efficiency can yield opportunities and otherwise inform their long-term strategies and day-to-day tactical decisions.
After all, while the price per square foot or square meter matters, the number of these “units” required to house a company’s workforce is also material. Our benchmarking data as standardized across a broad range of companies and geographies reveals that most companies cluster in the 0.7-0.9 range. However, a key finding of best-in-class practices reveals that a few highly efficient companies are able to achieve ratios in excess of 1.0, sometimes well in excess.
EXHIBIT 1 displays a large cross-sampling of our members arrayed from high to low based on FTE’s per Seat. The average is 0.9; the median is 0.8. As the exhibit demonstrates, three different companies are highlighted on the high end of the scale with ratios ranging from 1.1 to 1.6. These remarkably high ratios are impressive in their own right, and even more so given that these are portfolio averages across an entire office base, including headquarters.
The three companies achieving the most favorable ratios represent the competitive Technology, Financial Services and Professional Services sectors. While the sectors have very different cultures and practices, all three are global companies, have large (>40 office) corporate real estate footprints and a significant portion of their employee base devoted to client solutions. As a result, they are well positioned to impose aggressive seat sharing targets.
When we look more closely at the data, one of the peers has successfully implemented a restrictive ratio of seats and employees. Specifically, a seat is made available only to those employees who are onsite 60% or more of their time. All other employees are asked to share seats on either a first come basis or through an online reservation system. The company makes effective use of other “seats” in shared areas such as collaboration rooms, café’s and conference rooms. They have established additional ratios between the number of individual work seats to the seats, size and configuration of the shared rooms. On-site wifi enables staff to sit anywhere in the facility. The company also keeps individual workstations small: their current standard is 6’x6’ or 6’x8’ in cubicles with low-rise partitions.
EXHIBIT 2 shows this company’s FTE per Seat ratio by office location. The highest density sites are in the central districts of large urban centers, and not surprisingly, these offices are characterized by higher levels of staff in sales and client service functions. Many offices have ratios in the 2-5 range, which then positively influences the overall average in a material way.


Although these peers are able to capitalize on certain structural characteristics of their workforce, their success in achieving high FTE-to-Seat ratios has lessons for every company pursuing reductions in space utilization. Even if a workforce may not be considered to be as mobile as in some types of companies, a closer look will most likely reveal that there are employees who can, do and/or would work remotely or flexibly, be it from home, client sites, or in a shared seat environment.
Technology now enables individuals to be highly productive in a wide range of settings. The delivery of work is increasingly more ad hoc and cross-functional. Project teams can form, disband and re-form to meet ever changing demands. The pressing imperative to innovate demands more face-time across cross-skilled workers regardless of their hierarchical or departmental function or title. All of this when taken together leads to workplace design with smaller individual workstations, more “free desking” and the increased provision of collaborative space. When done properly, companies will yield the benefits of enhanced productivity and accelerated innovation. The “hard’ metric to capture these benefits is FTE’s per Seat.